Nifty Weekly Chart Analysis: Understanding the Current Market Trends
- Nitin Shripad Joshi
- Sep 4, 2025
- 2 min read
Updated: Oct 4, 2025

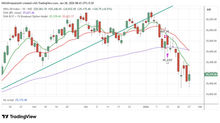
The Nifty weekly chart shows the EMA 55 still trending upward. Let's break down the current wave according to Elliott Wave Theory. We will analyze the current wave in five sub-waves.
Understanding the Waves
Wave 1 of 5 (Impulse): This wave began at a low of 21743.65 on 07/04/2025 and peaked at 25669.25 (all-time high) on 23/06/2025. This movement resulted in a total gain of 3925.6 points over 77 days.
Wave A of 2 of 5 (Correction - Downward): This wave started at the high of 25669.25 on 23/06/2025 and fell to a low of 24337.5 on 04/08/2025. It recorded a total decline of 1331.75 points over 42 days.
Wave B of 2 of 5 (Correction - Upward): Following the downward correction, this wave began at a low of 24337.5 on 04/08/2025 and rose to a high of 25163.65 on 18/08/2025, gaining 826.15 points in just 14 days.
Wave C of 2 of 5 (Current Correction - Downward): Currently, we are in this wave, which began at a high of 25163.65 on 18/08/2025. This downward correction may last for 42 days, potentially resulting in a decline of 1331.75 points, ending around 23831.90 on 29/09/2025. The 50% correction level, as indicated in the chart, is 23706.45, making 23831.90 a critical target.
Current Position: Nifty is currently above the 38.2% correction level, which stands at 24169.65.
Key Questions to Consider
Will Nifty drop to 23831.90 in the current scenario? Or will wave 2 terminate earlier?
Observing the chart, the last five weeks show that all weekly lows are nearly the same. Does this indicate a strong support level on the small green line? If so, we might conclude that wave 2 (correction) has ended at a low of 24432.70 on 01/08/2025, and wave 3 of 5 has begun.
Confirming the End of Correction
To confirm the end of the correction, we need to monitor the following:
Support Level: Nifty must not break the small green line.
SMA 5 Signal: The SMA 5 should provide a buy signal on a weekly basis, which is currently in a downward trend.
Heikin Ashi Chart: This chart should reverse to a bullish pattern, as it is currently in a bearish state.
If all three conditions are met, we can confidently say that the correction has ended and that wave 3 of 5 has started, targeting approximately 25358.60 by 17/10/2025. Otherwise, we will continue to follow the scenario outlined in point 4.
Conclusion
Understanding the Nifty weekly chart through the lens of Elliott Wave Theory provides valuable insights into market trends. By analyzing the waves, we can make informed decisions about potential market movements.
Stay tuned and keep your analysis sharp. The market is always evolving, and being prepared is key to successful trading.
Nitin Shripad Joshi
श्रीमद्भागवतगीता प्रवचनकार
9922081120


Comments